 by
by Today we’ll take a look at the last component of Elastic’s ELK stack – Kibana. Even though Logstash does a great job of processing logs and other data streams, and Elasticsearch is a powerful hybrid of a search index and a storage for them, these tools do not provide graphical user interface for analyzing the data. For some tasks otherwise convenient command line interface is just not enough. This is where Kibana steps in.
What is Kibana
Kibana is web window to Elasticsearch. It allows running queries, building graphs and dashboards and drilling down through the data. With the help of X-Pack it also gets alerting, monitoring and few other capabilities. As it’s a UI tool, it doesn’t make much sense to go through every button and the settings it has. Instead, we’ll take a quick tour at its major features that can make our lives easier. But before we can do that, Kibana needs to be installed first.
Installation
Like any other of its ELK stack siblings, Kibana needs Java installed. After that the installation is merely a download-and-unpack process. When you have it installed, starting bin/kibana will finish the ritual. However, without Elasticsearch installed nearby Kibana is quite useless. If you have one, config/kibana.yml‘s option called elasticsearch.url should get the reference to it and the installation is over.
But there’s easier way to get it running locally. We can start Kibana and Elasticsearch in Docker using official images. If they run in the same network and container with Elasticsearch is called elasticsearch, they will be able to find each other using default settings. The following docker-compose configuration will be able to fulfill both requirements:
|
1 2 3 4 5 6 7 8 9 10 11 |
version: '2' services: elasticsearch: image: elasticsearch:5.2 ports: - "9200:9200" kibana: image: kibana:5.2 ports: - "5601:5601" |
Just start containers with docker-compose up, give elasticsearch some time to finish initialization and then open Kibana’s home page at 127.0.0.1:5601.
Adding some test data
Another installation related task is test data. As Kibana is data visualization tool, naturally you’ll need some data to visualize. Likely, official getting started guide has few testing datasets ready, as well as the instruction how to deploy them. Basically it’s download, unzip, send to Elasticsearch.
Index patterns
If you’re going to use Kibana against large dataset of logs, chances are that you’ll store them in separate indices grouped by dates, e.g. mylogs-2017-01-01, mylogs-2017-01-02, mylogs-2017-01-03, and so forth. But for visualization purposes it makes sense to treat those indices as one.
In order to achieve that Kibana has so called index pattern, which is a string with * as a wildcard that matches all indices you want to treat as one. For our example that would be mylogs-*.

When it’s saved, you’ll be able to use mylogs-* name as a regular index name.
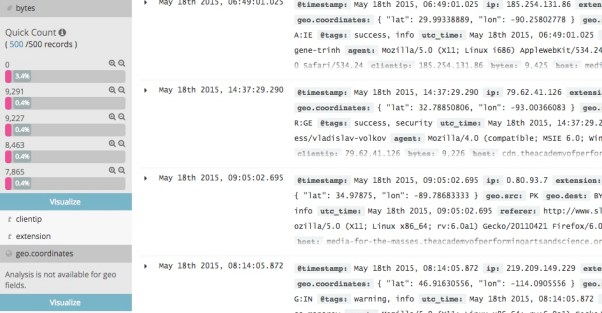
Discovering the data
“Discover” menu item is the place to go when you don’t know yet what exactly you have in your data. The page will greet you with a search box that understands Lucene search syntax, bar chart with selected index data distribution by time, and some by-field statistics.

Lucene search syntax is surprisingly simple. * will match everything, 13 will match documents with 13 in them, and response:404 AND request:*.css will match all requests to CSS documents that returned 404 NOT FOUND.
Another neat thing is that document fields list at left hand side are very clickable. They also come with reasonable statistics and even type sensitive suggestion to visualize fields data.
For instance, “visualize” button for numeric types will bring up a bar chart, but for geographic coordinates it will take you directly to the map.

Visualizations
Kibana also has many other visualizations, starting from counters and charts, and finishing with Markdown blocks and tag clouds. You can find all of them at “Visualize” page:


There’s nothing special in those charts, but I’d like to highlight two things. Firstly, everything in them is still clickable, and selected element goes directly to the list of search parameters. It’s not very useful for chart itself, but comes in handy at dashboards.
Secondly, chart can be saved and then reused at a dashboard.
Dashboards
Dashboards page makes it possible to bring previously saved visualizations together.

Here’s where the ability to click at any given row, or tag, or value and add it to search params becomes very useful. I could click at specific tag, e.g. US, and that selection would propagate to all charts on the page, updating counters, charts, and so forth.
What also convenient is that search bar is still on the page, so we can narrow down data selection even further:

Timelion
Timelion is an interesting beast. It’s time series data analyzation and visualization tool that comes with its own language for defining and manipulating data queries. It can take data from different data sources, apply functions to them, change appearance like labels and colors and put everything back to the same graph. There’s a good (and short) blog post describing why Timelion exists.

Summary
Kibana is a nice tool to start digging into the data you managed to collect in Elasticsearch. It allows running queries, building graphs and dashboards and even tries to predict what you might want to do next by adding quick statistics and links to visualize fields.
Unlike Grafana, it won’t work with any data source other than Elasticsearch, but given how tightly it integrates with the whole Elastic stack, it is not a sin.


One thought on “Visualize Elasticsearch data with Kibana”